Tracer
A serial monitor for engineers who care about their data. Every session is recorded the moment you open a port — no record button to forget — and stored as ordinary files on your own machine.
Opening Tracer the first time
Tracer is not yet signed with an Apple or Microsoft certificate, so your operating system will ask before opening it the first time. The download is fine - the OS just cannot confirm who published it.
macOS: open Tracer, and macOS will refuse. Go to System Settings → Privacy & Security, scroll to the bottom, and click Open Anyway next to Tracer. On macOS Sonoma and earlier you can instead right-click the app and choose Open.
Windows: SmartScreen shows “Windows protected your PC”. Click More info, then Run anyway.
You only do this once, on first launch. Updates afterwards install without any of it.
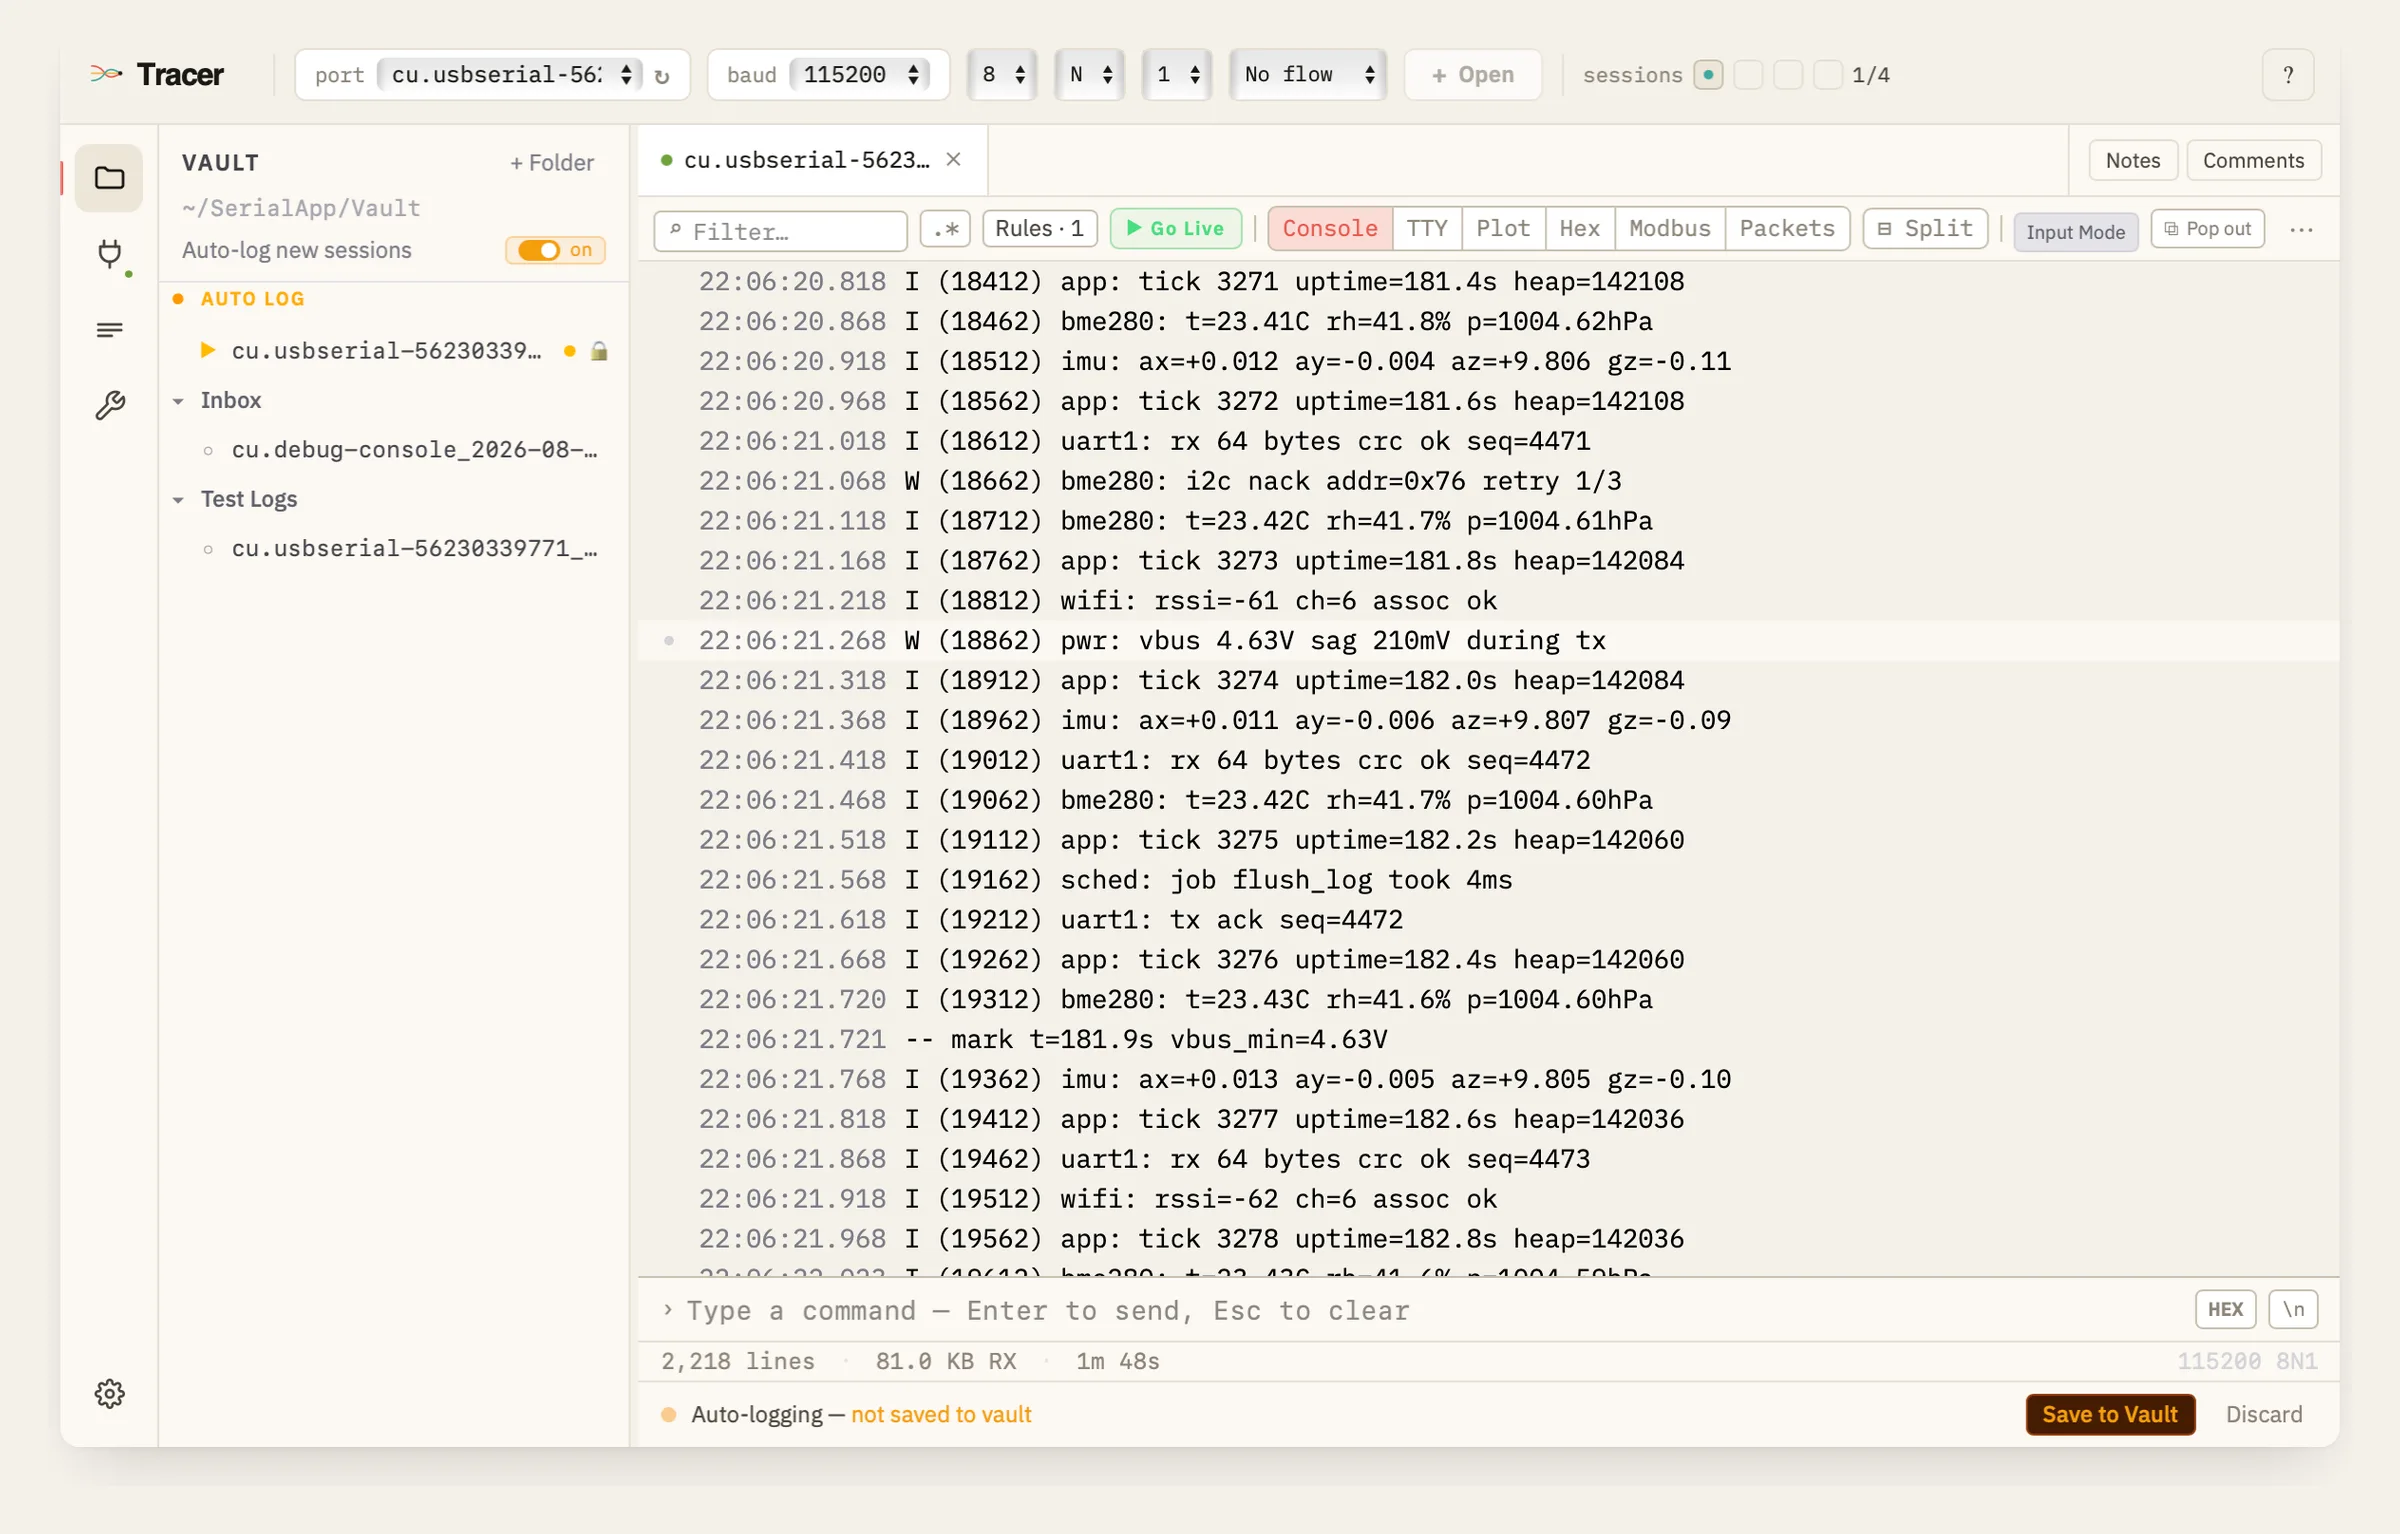
The idea: most serial monitors show you a stream and throw it away. Tracer keeps every session, lets you annotate it, search it, decode it, and come back to it months later when the same bug reappears.
Your sessions, kept
The Vault
Opening a port starts recording immediately. Press Save, name the session, and
it lands in your vault at ~/SerialApp/Vault/ — a plain folder of
plain files, organised like anything else in Finder.
- Anything you never save is still kept under
Auto Log/, so a session you didn't expect to matter is recoverable - Drag to reorganise, rename inline, nest in folders
- Reopen any saved session as a read-only tab — with search, hex, and the decoders all still working on it
- Export to
.txtor.csv, with annotations carried along - No database lock-in: the files are yours, readable without Tracer, forever
NotesPro
Every saved session gets a markdown scratchpad. Wiring, test setup, what you were trying to prove, what you concluded. Saves as you type, travels with the session file, and exports alongside the log.
Inline commentsPro
Right-click any line in the log to pin a note to that exact line. A yellow dot marks it in the margin from then on. Six weeks later, the line where the handshake failed still says why it mattered.
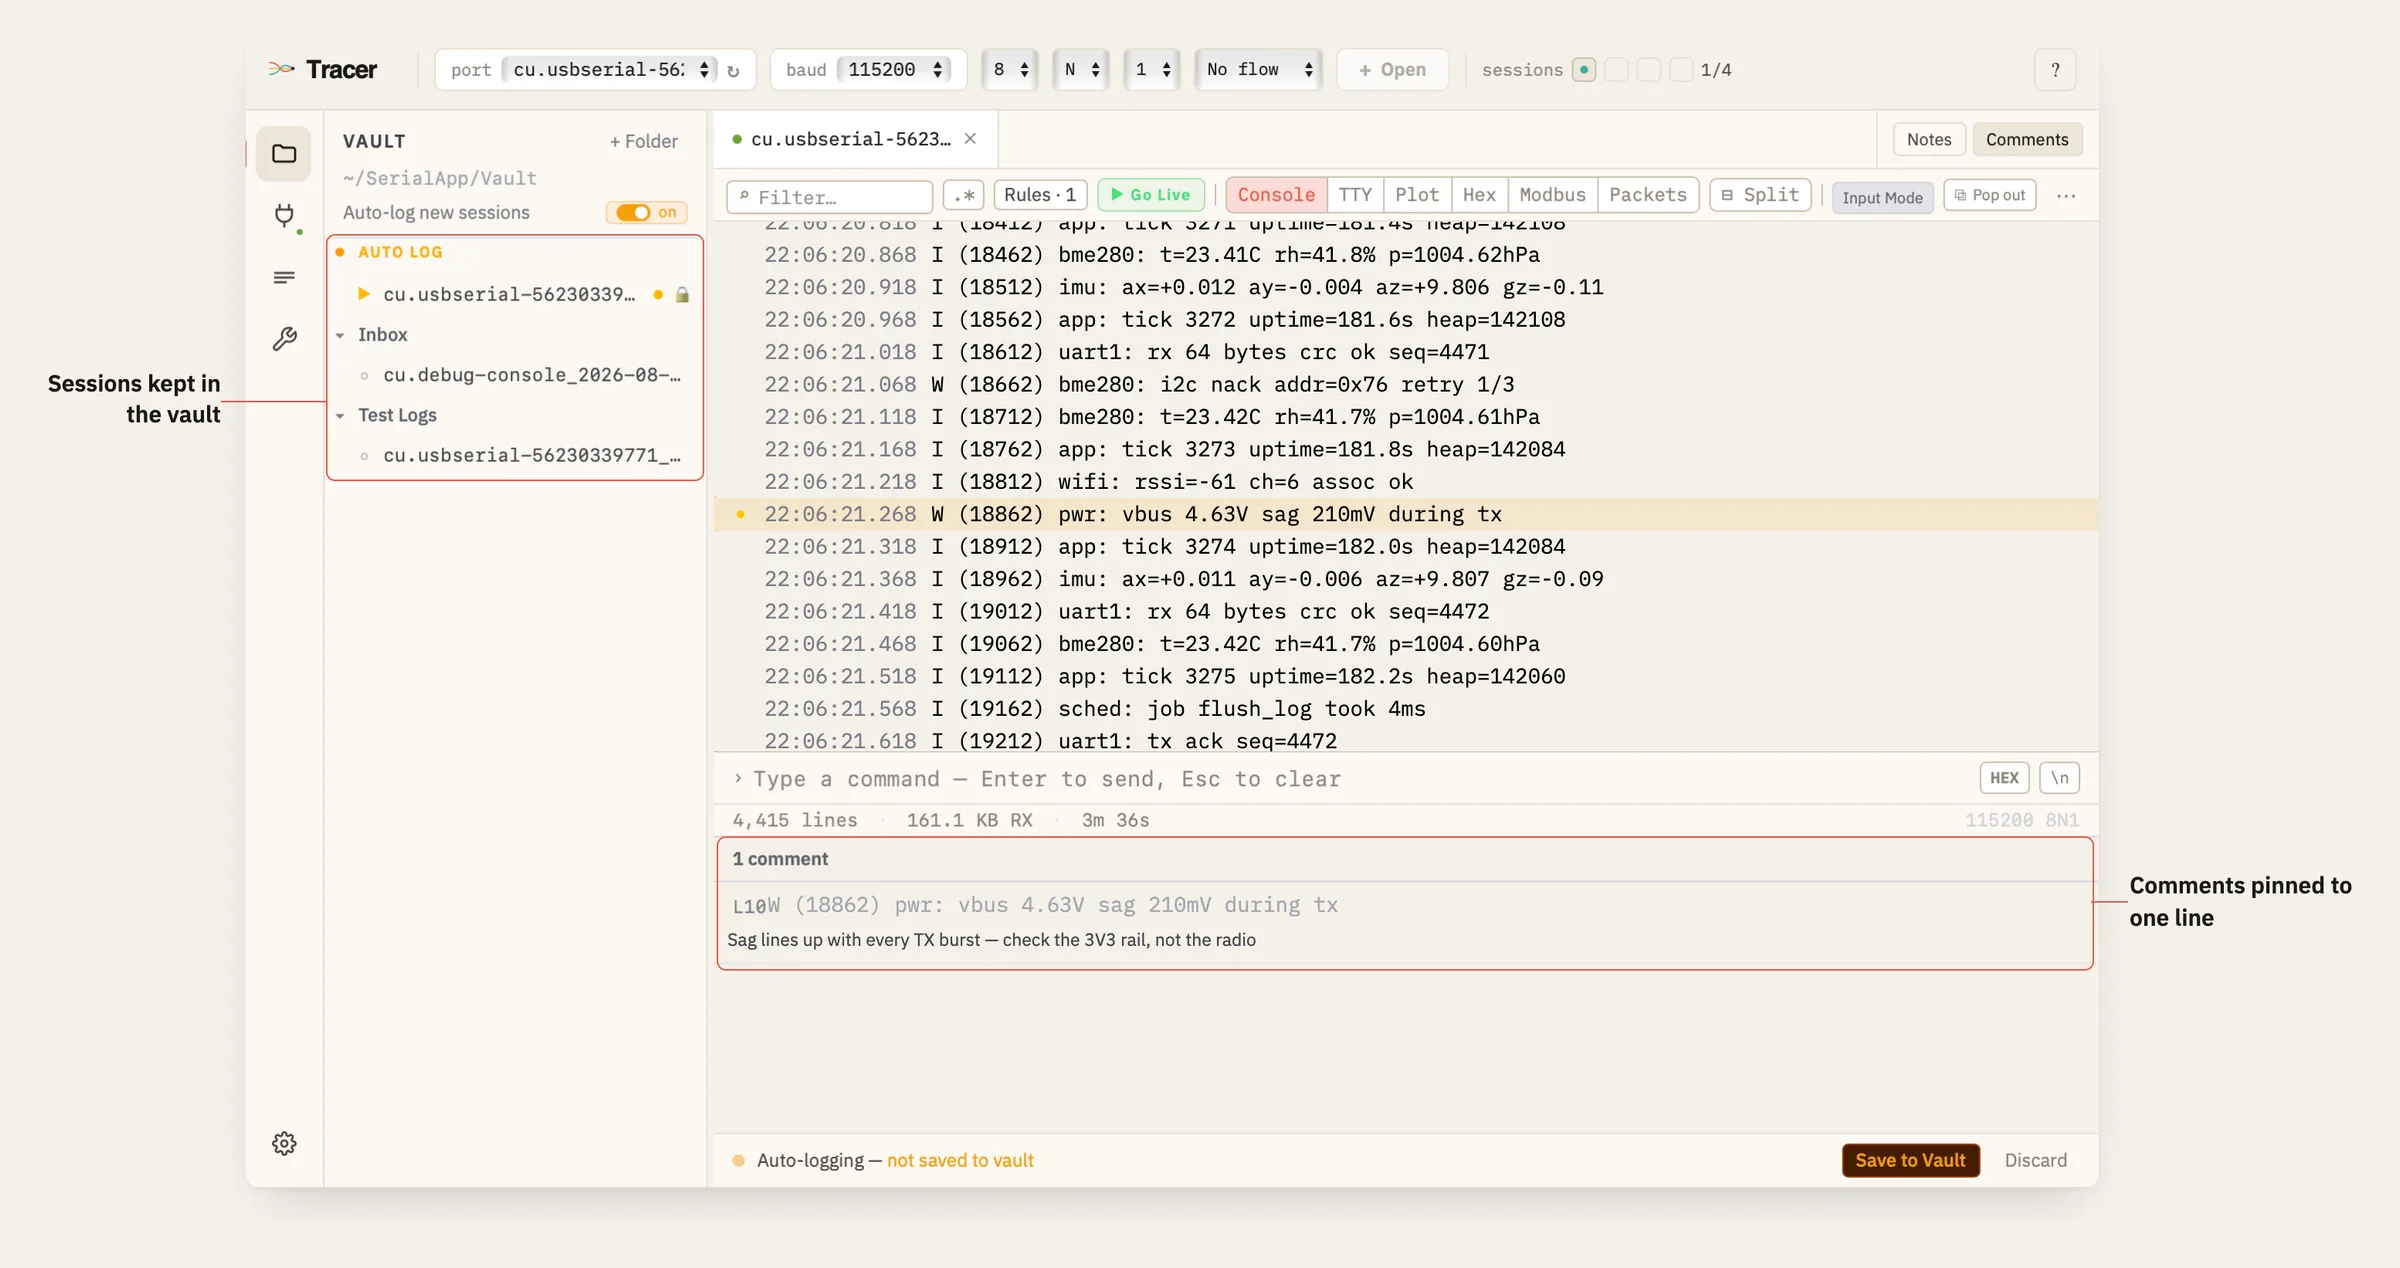
Finding the one line that matters
Live search and filtering
Press ⌘F and filter the stream as it arrives — plain text or full
regex, with matches highlighted in place. Works identically on a live capture
and on a session you recorded last month.
Highlight rulesPro
Colour whole lines by pattern — errors red, handshakes green — so problems stand out while you're watching, not during the post-mortem.
Variable extractionPro
Pull a named value out of each matching line — temperature, RSSI, state — and watch it update live above the log instead of reading it out of the scroll.
Six ways to read the same stream
The mode picker changes how the data is displayed, never what is captured — so you can switch views on a session you already recorded.
Console
Line-based log with timestamps and RX/TX colouring.
Terminal
A real VT-100 for shells, REPLs, and anything that redraws.
Hex
Offset / hex / ASCII dump for binary protocols and framing bugs.
PlotterPro
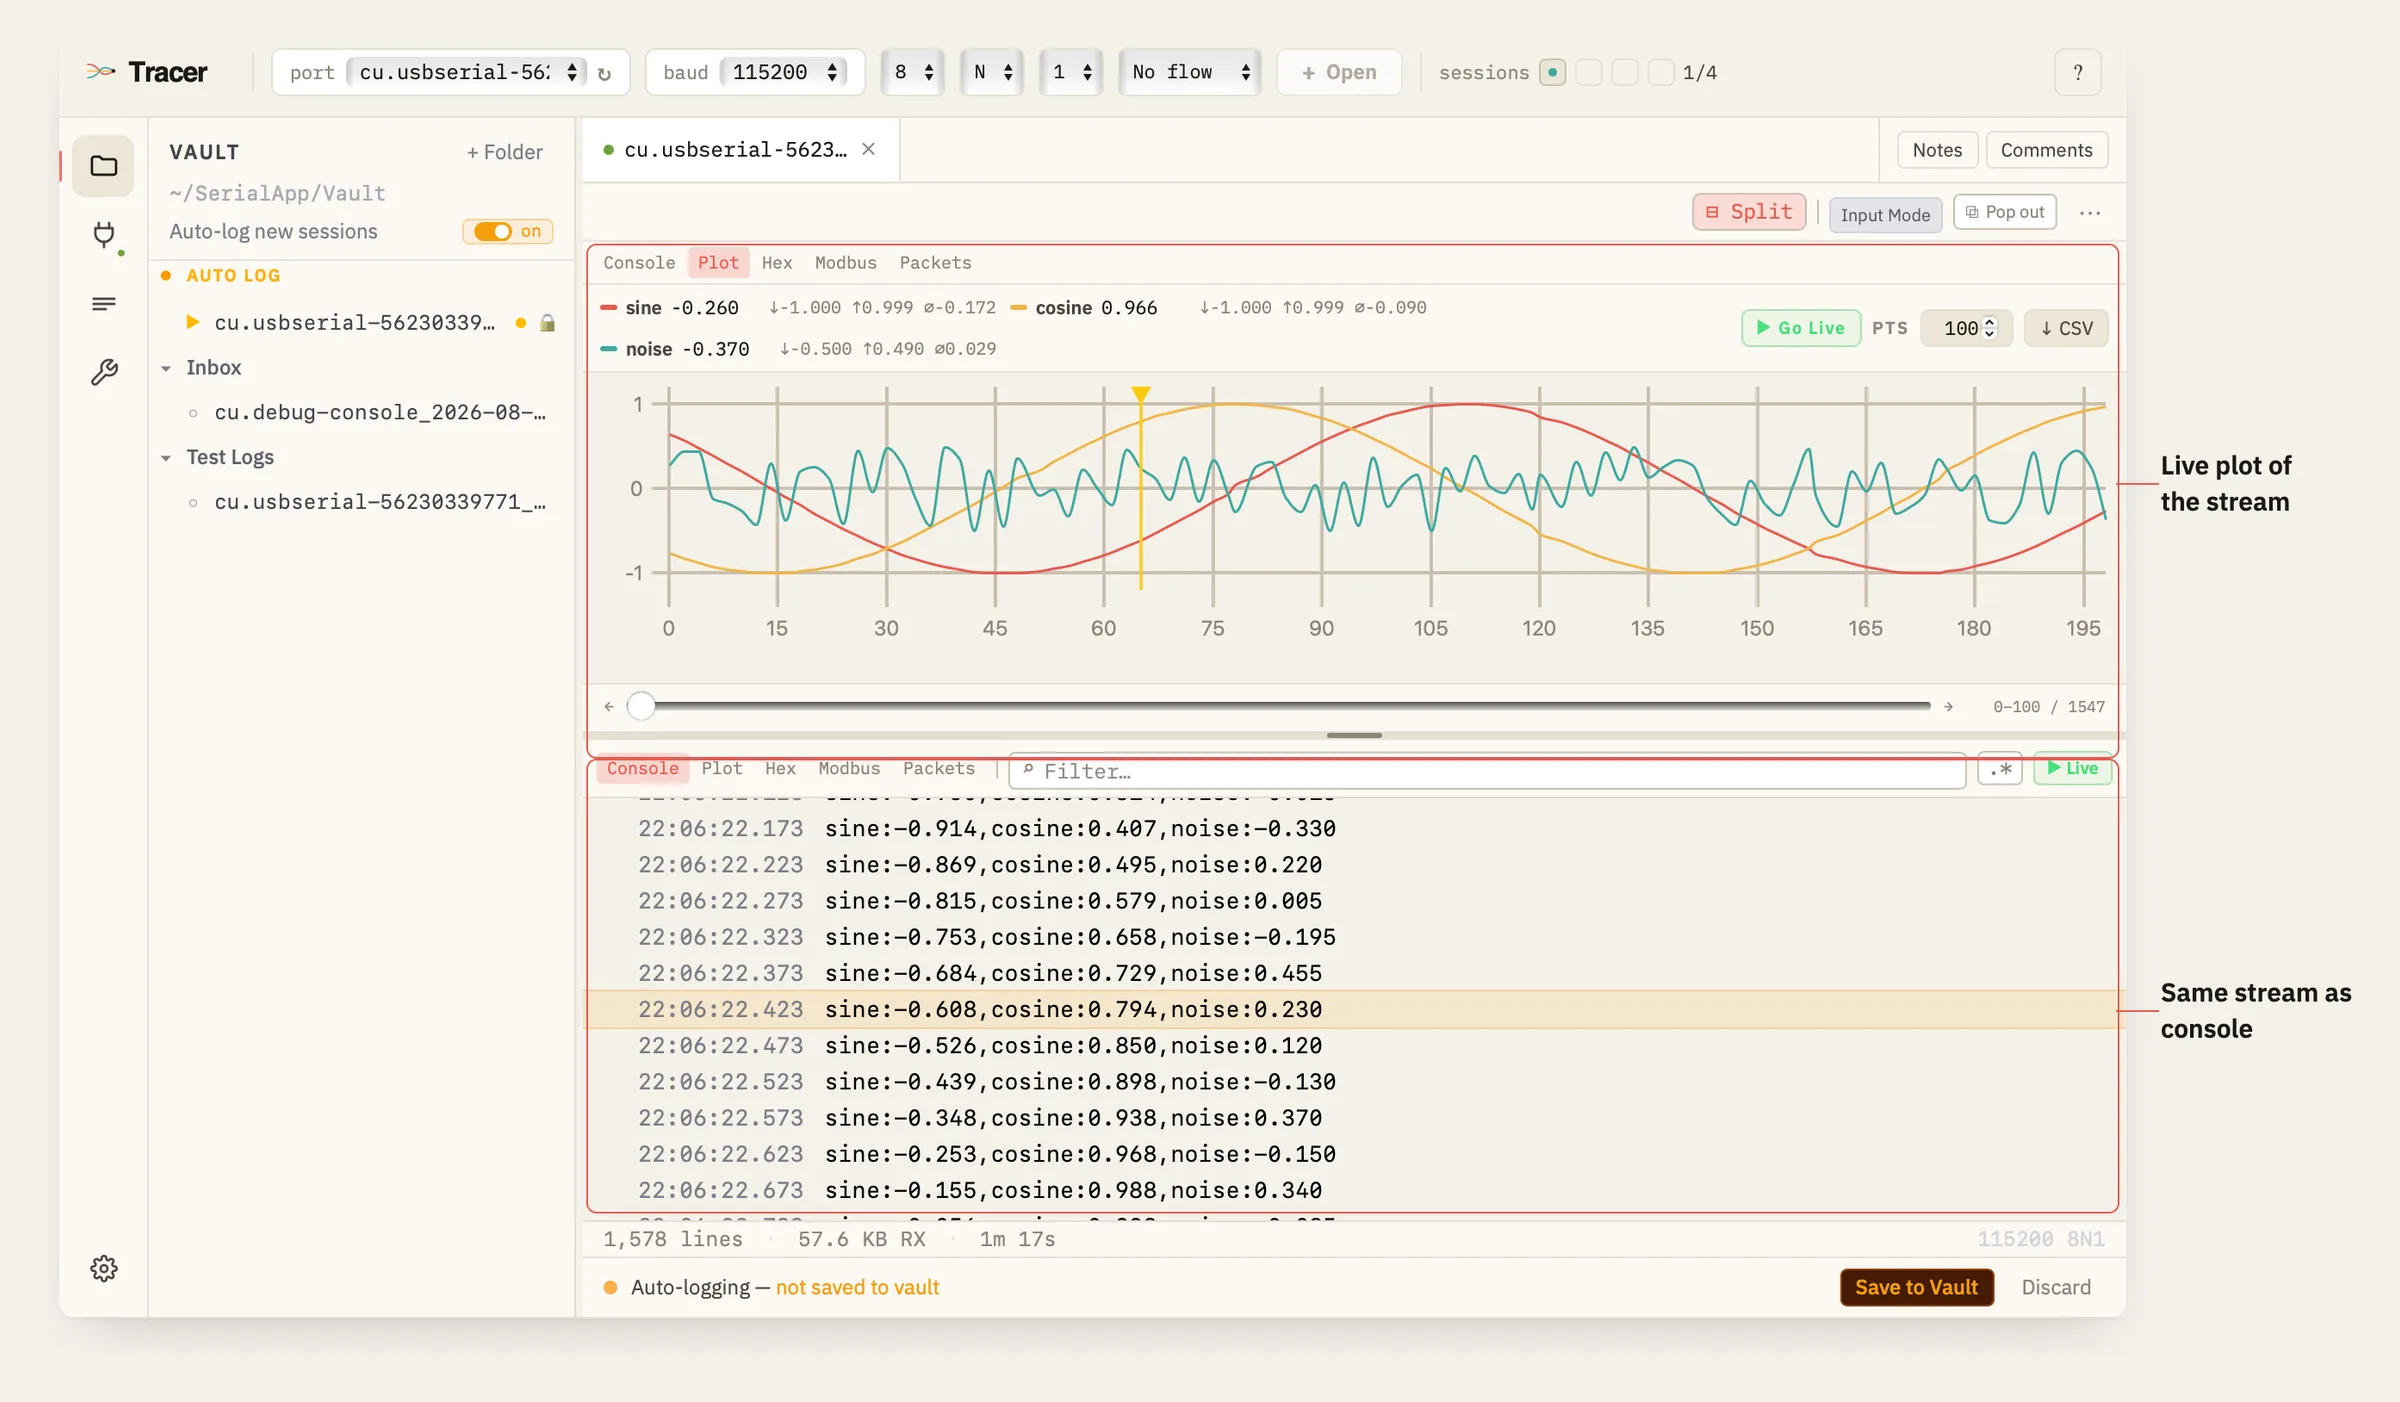
Graphs numeric values as they arrive.
Modbus RTUPro
Decodes frames into function code, address, registers, CRC.
Packet decoderPro
Split by idle gap, delimiter, or fixed length, then name the fields.
Split the pane to run two of them side by side. Console next to hex is how most framing bugs actually get found.
Talking back
- Line mode for commands, raw mode when every keystroke should go out as a byte
- Hex input, configurable line endings, real
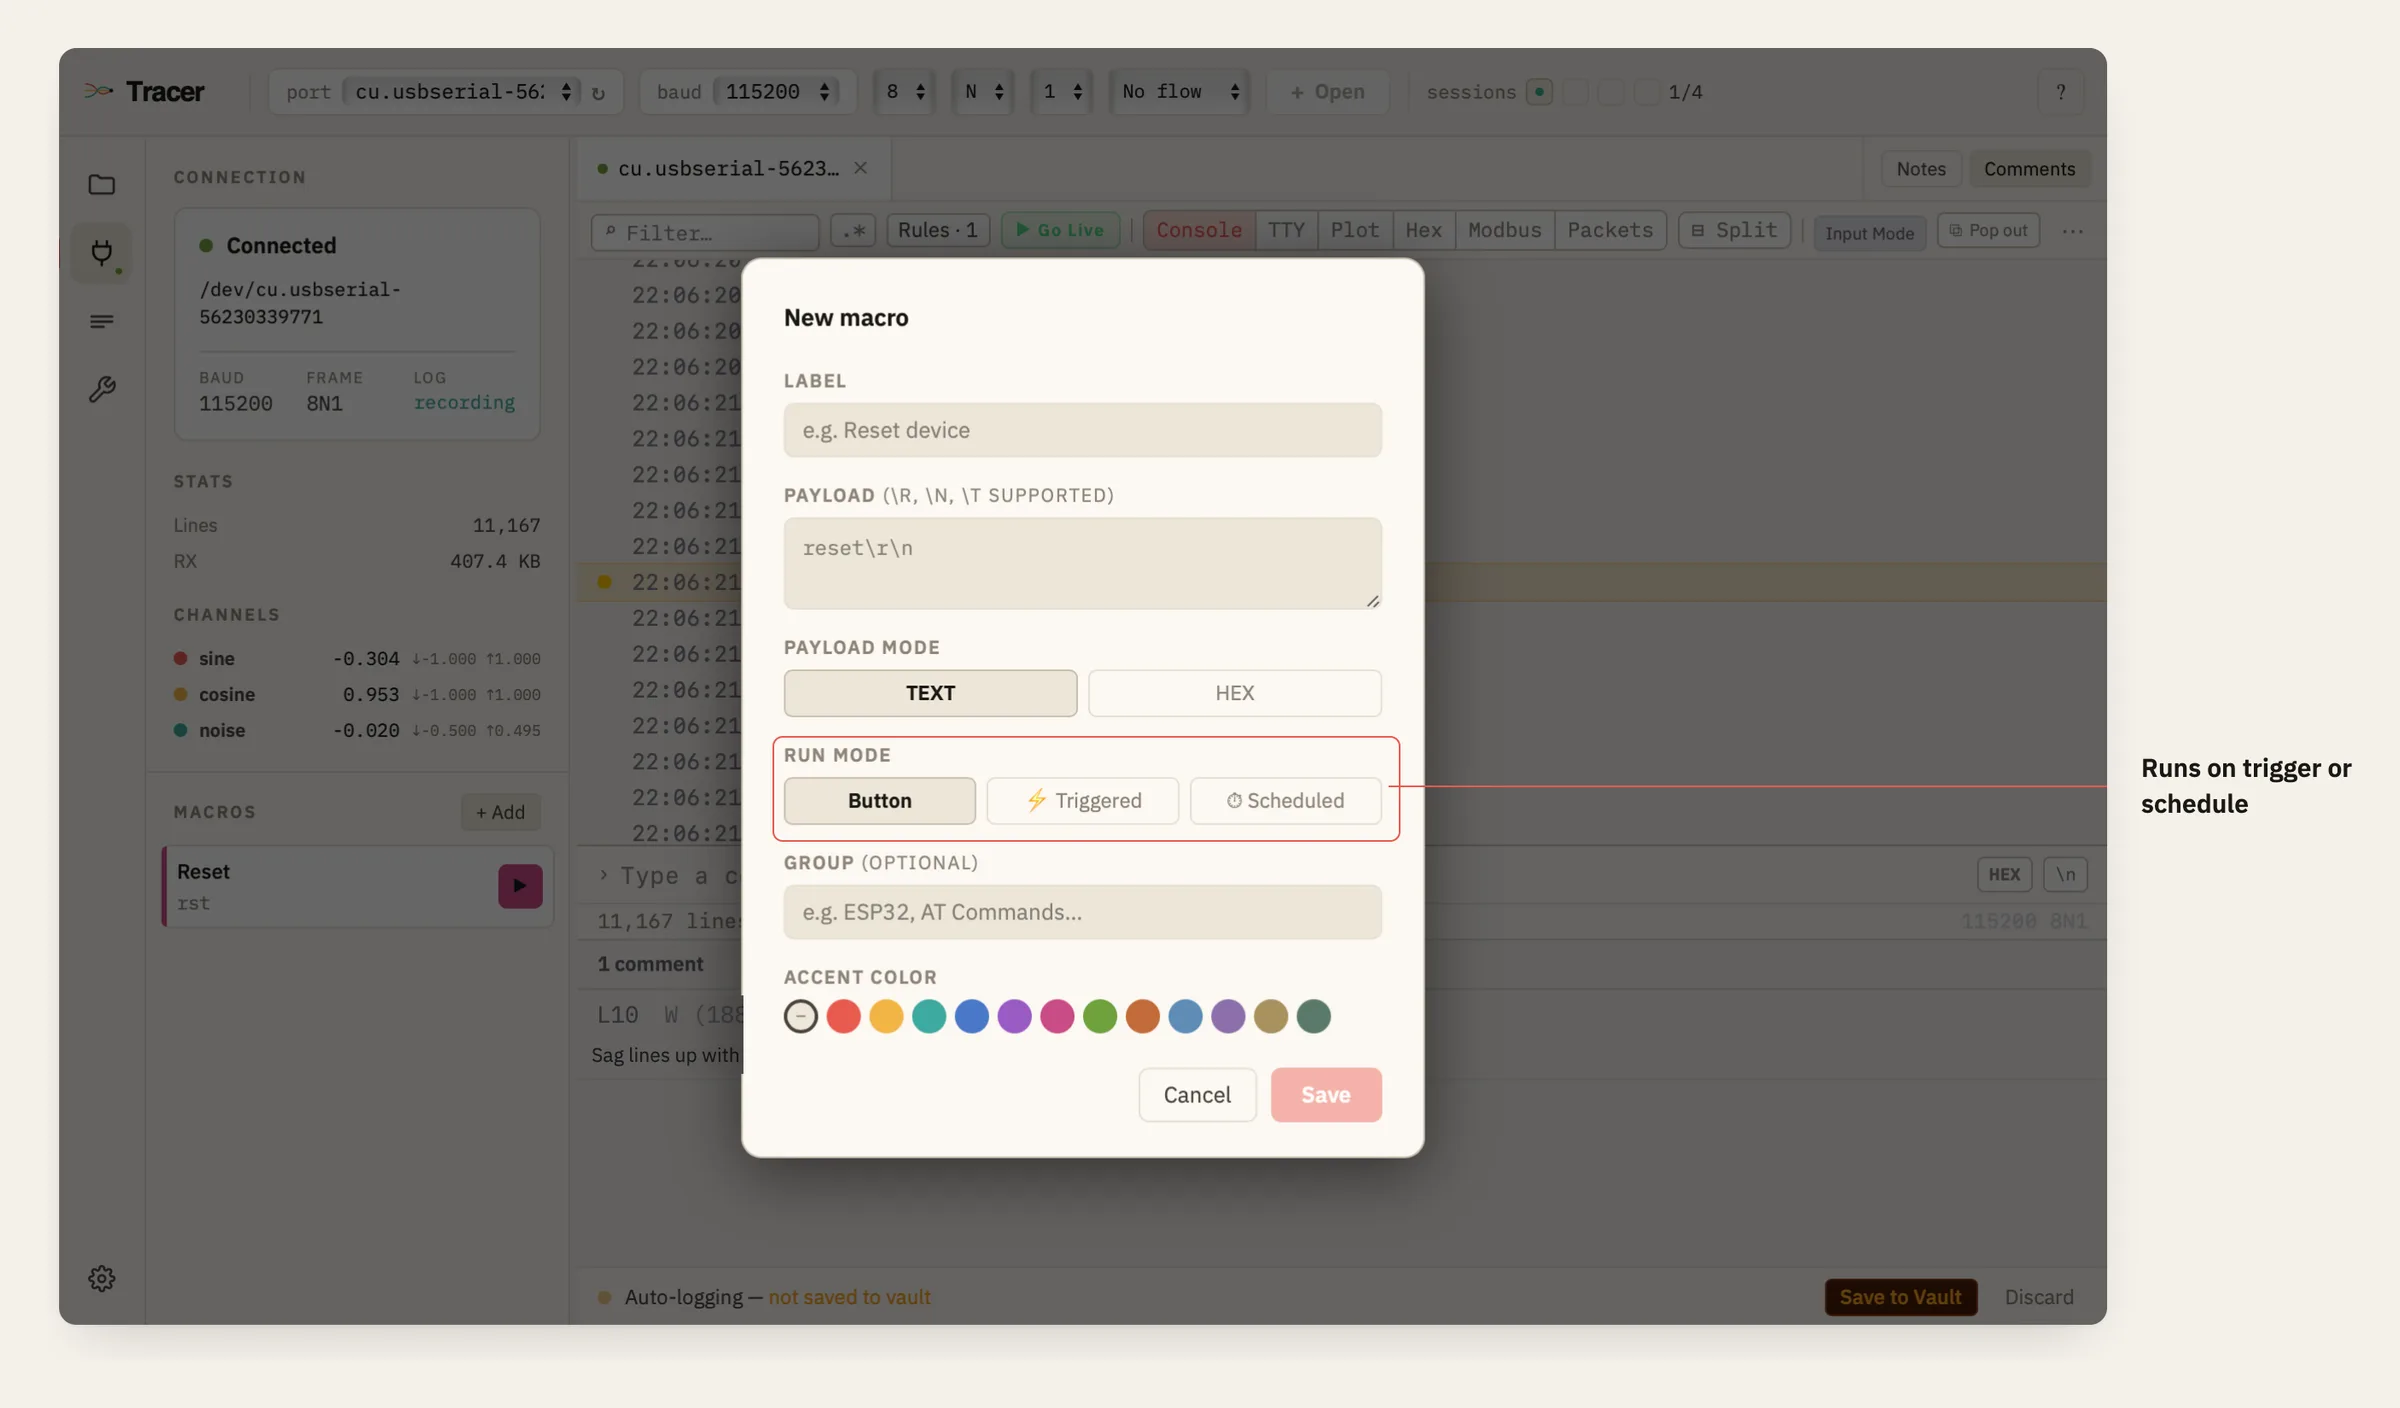
Ctrl-C/D/Z, BREAK, and DTR/RTS reset - Macros — saved text or hex payloads, grouped and reorderable, fired with a click
- Triggered macrosPro — fire when incoming output matches a pattern
- Scheduled macrosPro — fire on an interval for polling loops and soak tests
- CRC calculator with every common preset, plus a custom mode
- File send — stream a file out in chunks with progress and cancel
Built for a real bench
- Up to four ports open at once, each in its own tab
- USB devices reconnect automatically after a reflash or a replug — the session survives
- Pop-out windowsPro for watching two ports across two monitors
- Scripting APIPro — a local WebSocket server so your own scripts can read and send while you keep watching
Free and Pro
Free
No account, no time limit
- Console and terminal views
- Hex dump
- Split panes
- Vault, logging and search
- Manual macros
- CRC calculator and file send
- Export to .txt and .csv
Pro $29.99
One-time purchase — no subscription
- Notes and inline comments
- Plotter, Modbus and packet decoders
- Highlight rules and variable extraction
- Triggered and scheduled macros
- Pop-out windows
- Scripting API
Pro is free to try for 7 days — no account, no card. When the trial ends the free features keep working and every session you recorded stays exactly where it is. Purchases are covered by a 14-day money-back guarantee.
Buying and activating
Five minutes, no account to create. The trial does not need any of this — it starts on first launch and Pro is simply on for a week.
- Buy Pro — $29.99, once Card or PayPal, in your browser.
- Your license key arrives by email It is in the receipt, sent immediately after checkout.
- Paste it into Tracer Settings → License → Enter license key, or click the trial chip in the toolbar. Paste, press Activate license, and the Pro features unlock on the spot — no restart.
Changed your mind, or it does not do what you needed? The 14-day money-back guarantee covers it, no reason required. Lost the key, or having trouble activating? Email [email protected].